The Two Lengths of the Aletsch Glacier
A map may label a glacier with its total length. A monitoring record asks how far its end moved, relative to a documented position and direction.
In this story 4 sections
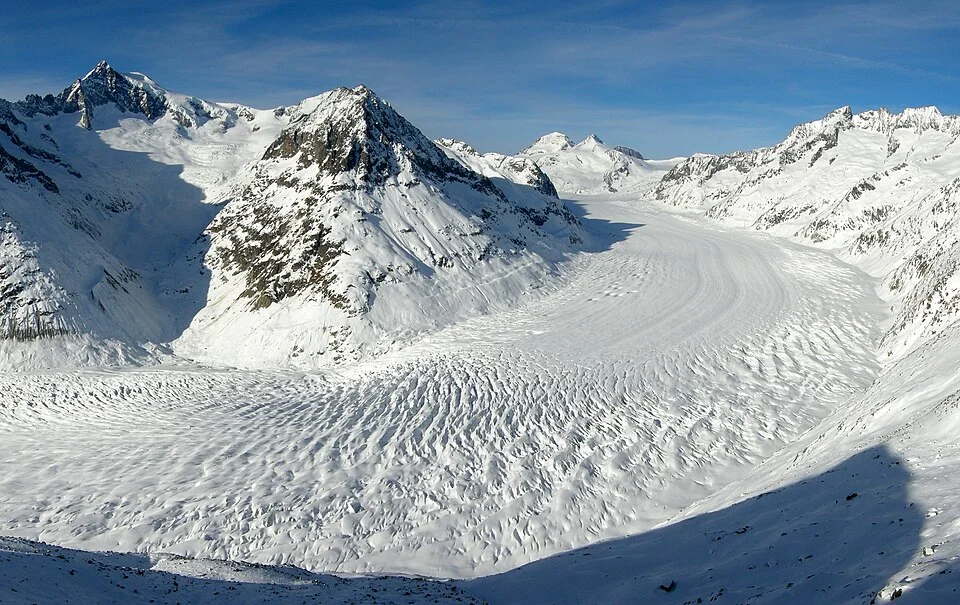
The Great Aletsch Glacier in the Swiss Alps offers a strikingly incomplete view even from a high platform. From Eggishorn the ice can look as though it begins somewhere open in front of the observer and runs away in a curve. Down in the valley the far lower end may be much harder to identify. Higher up, several areas feed into what a person looking across the whole valley experiences as one river-shaped mass. Asked for a length, one observer could be tempted to trace the dramatic central line in a photograph. Another might want to know how far a particular end of the glacier moved between surveys. They are asking for lengths of different things.
A glacier’s total length can be estimated from a chosen line along the glacier, with endpoints and a method. A length variation report compares defined positions of its front or terminus over time. In that second table it is quite normal to see distances much smaller than the whole length, and to see change expressed with a sign. The visible glacier is the setting for both records. Keeping a pair of sketched arrows next to the picture makes the difference easier to remember than reading two columns in two unrelated documents.
Follow the long line with a date attached
A map’s total length might refer to an outline from a particular survey and a central path chosen to represent the glacier. The path can turn as the valley turns. It would be surprising if the result always equalled the straight distance between two convenient endpoints on a regional map. A useful record identifies which upper and lower parts were included and what form of distance was calculated. A glacier does not have a precisely determined overall length without choices that give that measurement reproducible meaning.
As a small illustration, draw a very irregular ribbon across a piece of paper and set two marks at its ends. Measure one connection roughly along its middle and another in a straight line between the marks. The first might be much longer even though both touch the same endpoints. In the actual mountains you add height and shape to questions of definition. A map that offers a measured projected length and a walk along the actual angled ground need not describe the same length. Choose the type of comparison before asking how exact a number is.
Now imagine a faded caption next to a strong photograph. It gives a length, but nothing to suggest when that length was considered appropriate. A figure that suits a source’s date may no longer be a description of the site today. This is a reason to copy references with their dates rather than copying numbers alone. The cover photograph gives the structure of the valley at a particular time and position. It supplies a useful setting that a sheet of lengths cannot show. It is not a recent measurement simply because someone published it this week.
The end can be described by several points
Monitoring a front can require recognizing a position that other observers will be able to find or reproduce. An ice tongue is not manufactured with one perfectly smooth end. There may be an uneven margin, material lying over parts of the ice and changing water or rock to either side. A survey needs a convention for comparing the old and new positions. Some observations are taken at recognizable locations using field methods; others rely on dated outlines and suitable images. Swiss Glacier Monitoring describes different length monitoring methods and their strengths and limits.
A middle portion of a terminus can move by a different amount from another part of the edge. If a report averages several points or uses defined transects, the resulting number does not necessarily describe the shift at the one rock you picked as a landmark. It helps to indicate several places on a diagram of an irregular front. Make a line for the old observed positions, then another line for the new ones. The difference you chose to measure will have a direction and width of comparison. Its meaning does not come simply from the two front lines being near each other on the page.
Where the cover photograph is taken from, the large open view is highly useful for seeing how ice follows the form of the valley. It can be a poor vantage point to verify every feature of the front without additional information. A lower portion can be hidden by a projection, and ice under debris is harder to map from above. A careful observation report is worth reading for how it resolved difficulties like these. Those notes often make a measured change more intelligible than an isolated number that looks wholly objective because it has been printed to several places.
Ice motion and front motion are different questions
Retreat can be an unfortunate word if it makes someone expect every part of the glacier to be moving uphill. Ice flows under gravity. A terminus can nevertheless shift back if the loss of ice near the end exceeds the quantity delivered to that area over the relevant period. Picture the front of a moving line at which material is steadily added from behind and removed near the front. If removal is faster, the visible end moves one way while individual material is still arriving from the other. The analogy has limits in a deforming mass of ice, but it keeps the two kinds of motion distinct.
One way to make the distinction useful in notes is to ask what was tracked. Was it a position on a surface, a reference mark that moved with the ice, or the actual boundary at which the ice ends? A chart of front variation can answer a question about the third thing. It does not directly report the speeds of individual parts of the ice column. Similarly, a measured movement over several seasons at an identified location does not necessarily become an amount lost over the whole glacier. That second judgment needs additional evidence about area, thickness or mass.
Suppose one observer describes a small shift between two annual visits, and another describes substantial thinning at an entirely different part. It is possible for both to have accurate observations. The glacier can change in thickness without immediately producing the same visible movement at the end. It can also have a conspicuous change at the end that represents a quite local condition. Before assessing a claim, notice the dimension it is in, the group of observations it builds on and the interval during which change was recorded.
If the measurements are given as a sum of several changes over several years, the baseline at the start deserves its own label. Changing that baseline can shift a plotted line without changing any of the original annual observations. Read which quantity a chart is adding before treating its highest point as a current length.
Let the map and the series complement one another
Place a commonly reproduced photograph next to a named map of the valley. Use the bend of the glacier and the shapes of nearby ground to orient them. Then take a documented time series and look for what its column labels say. An annual change in length should not be put on a map as the entire length of the glacier; a length reported with a survey date does not tell you the movement on each intervening day. Write down what the intervals were and what happened when no observations were available. A missing interval is recognizable as a gap rather than as a year when nothing changed.
A series that uses new methods can include valuable measurements alongside changes in the way a front is observed. Compare the description of each before assuming fractions of a meter have the same practical meaning from every source. Where an earlier survey and a newer one cover similar ground, a report may explain the relation and what can be compared. This issue is part of maintaining a record over generations. The challenge is to preserve comparisons through changing access, equipment, shapes and opportunities to observe.
An outline preserved in a report also gives local meaning to what might otherwise sound like a national or regional total. One can place a shift in the view of a valley without claiming that other glaciers moved just as far. A vivid example can carry its own evidence. It should not stand in for the other examples that would be needed to make a regional claim. It is useful to hold both the small view in which a surveyor can reach one margin and the broad view in which the Great Aletsch Glacier lies inside a much larger alpine setting.
Return to the picture from Eggishorn and follow the whole turn of ice that it makes easy to see. Across one reading, you are following a great length of glacial landscape. Across the other, your attention goes to the end and to a way of getting back to a known position after time has passed. The first is valuable because it gives the shape a scale. The second makes it possible to say how a part of that shape differed at two stated moments. The photograph rewards both ways of looking without asking them to become the same measurement.