The Hill in the Middle of Quito
A view from El Panecillo gives Quito’s historic centre a different outline from a street map. The difference begins with the ground beneath the blocks.
In this story 5 sections
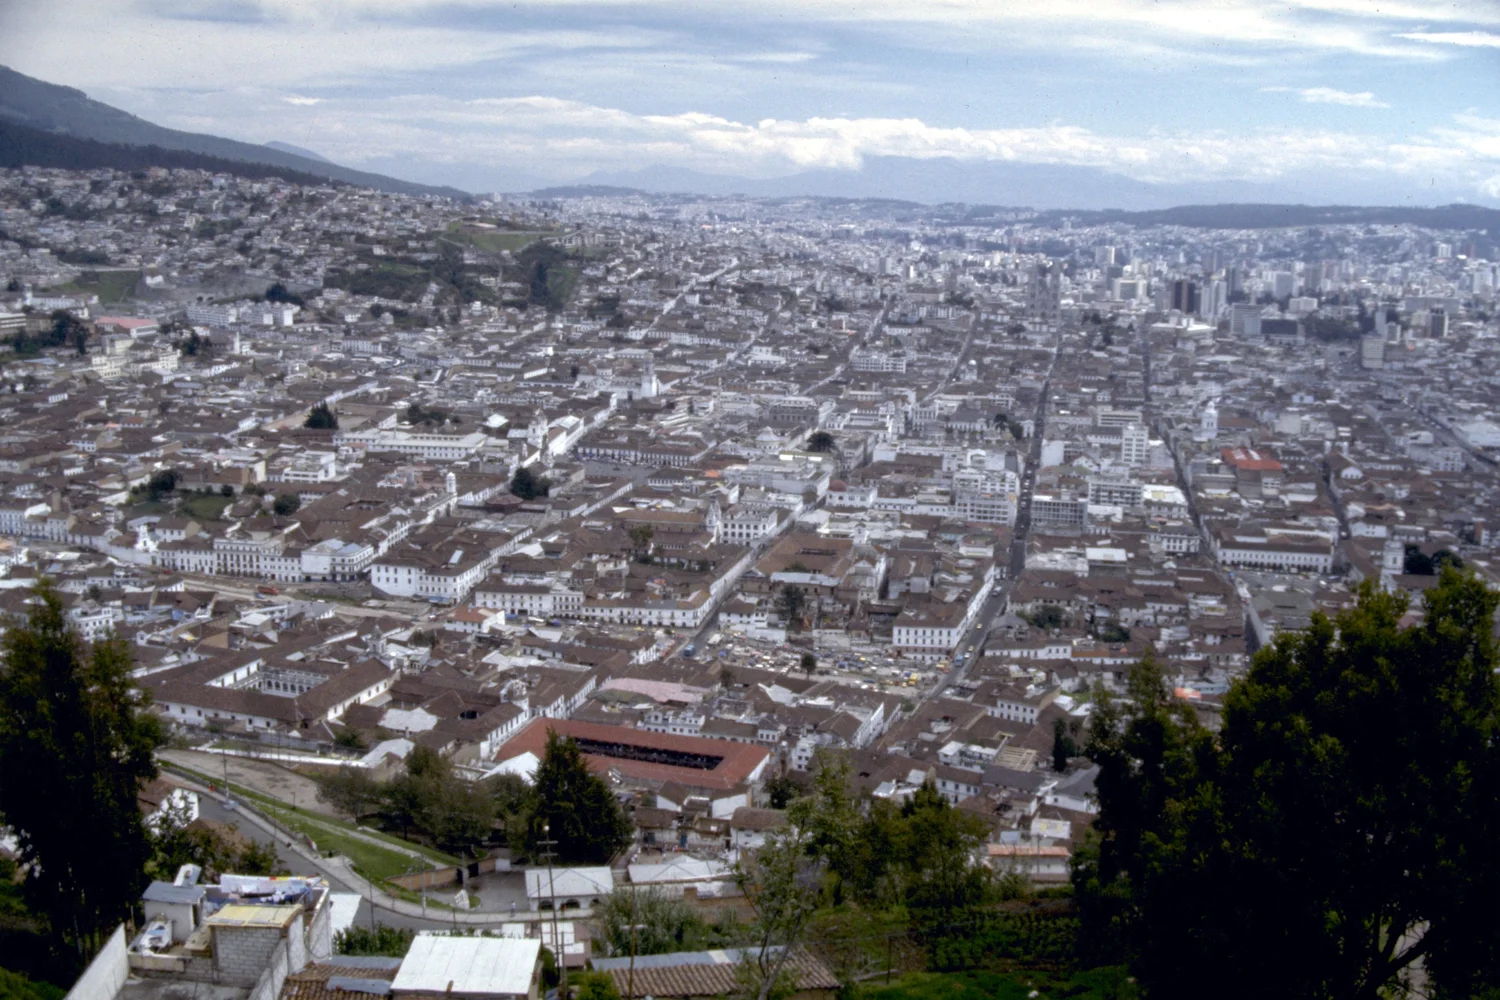
In the 1991 photograph looking out from El Panecillo, Quito seems to occupy almost every practical bit of land within view. Roofs gather around large buildings. Several streets can be picked out before they disappear into the roofs again. Higher ground stands against the sky. Seeing all of this from a raised point makes it tempting to identify the place as a single basin with streets spread across the bottom. A map with heights gives a more complicated answer.
UNESCO describes Quito in relation to Pichincha and hills including El Panecillo and Itchimbía. The municipality's historical description also names those hills and recalls the ravines that crossed the space occupied by the historic city. This is a case where a plan of roofs and streets can be entirely useful and still leave out information vital to explaining their arrangement. Begin with the centre of the picture, then follow the ground at the edges.
A viewpoint is part of the thing it shows
El Panecillo is not an observation tower put in a convenient place outside the subject. It is a hill within Quito, and a view from it uses part of the terrain to understand another part. A photograph from its slope has a perspective along which the nearest buildings can hide features just behind them. A large roof close to the camera can occupy as much space in the image as a whole block farther away. None of that is a defect. The viewpoint supplies the rise that makes the roofs visible in the first place.
A second view from lower ground would not simply reproduce the same scene with fewer roofs. It would make horizontal relationships easier to inspect and might make a small rise feel particularly steep along a single walking route. The first picture is better for seeing some patterns across the streets. The second could give better evidence for what stands at the end of a particular line of sight. Before putting the two on the same page, it helps to record where each viewer was standing.
That makes a useful exercise possible without travel. On a plan of Quito, label the hill from which the archival picture was taken. Then identify features in the picture that also appear on the plan. The direction of the camera matters more than the centring of the printed image. Avoid assigning an unfamiliar roof by comparing shapes only. A recognisable pair of buildings with a road between them can provide more reliable reference points than one tall form visible far away.
Why the shape of a block is only part of a route
A rectangle drawn from above need not sit level on the ground. A short street may have a steep section or connect along the same slope as the next route. The length marked by a plan is useful for a horizontal comparison. The effort of a walk is affected by the gradient and the crossings on the way. A photograph can make those slopes visible in broad outline without giving enough detail for somebody planning an actual trip.
Imagine a hypothetical straight path one hundred metres long in plan. If one end is ten metres higher than the other, the simple average rise is one metre in ten of horizontal distance. A second path with the same average can climb sharply just at the end. From the same start and finish, the two present very different experiences. Giving the length and the total rise is more useful than giving either alone, but a profile shows how the climb is distributed between them. These are illustrative numbers, not measurements of a Quito street.
That distinction provides a way to test what is left out of a visitor map. Does it help someone locate a public square, recognise a major route or understand the slope between two street corners? A single sheet does not have to do all three. If it presents the routes as equivalent with no mention of topography, a reader may mistake the shortest visible line for the easiest connection. This is a common consequence of treating a map designed to locate buildings as if it had also described the terrain.
A ravine can disappear from a drawing without leaving the history
The municipal plan's historical account identifies several ravines in the area of the old city, including the Quebrada de Jerusalén. That information puts another layer under the street plan. Channels that influenced a city's arrangement need not remain plainly visible in a current photograph. Crossing, covering, filling and rerouting are different events; each would require evidence in a particular case. The mere absence of an obvious dark line among the roofs does not prove that the ground beneath them was always simple.
When comparing old and new maps, one can start with fixed points such as a long established major building or a recognisable hill position. Then ask how ravines or gaps were marked in each version. A line can change for many reasons. Perhaps the area actually changed. Perhaps one map wanted a readable guide to buildings and omitted a feature present on another. Perhaps the two used different scales. Reading a legend and date is more useful here than immediately treating all disagreement as physical change.
This is an especially important caution in a dense city where the map has to simplify. A printed line thin enough for a small page might make two features look as if they meet. Street names may appear in a position chosen for legibility rather than directly above the place they name. To ask whether a new street crossed an old ravine is to ask for supporting documents, not merely for the confidence that comes from matching two differently printed sheets.
The historic area also has an edge drawn for a purpose
UNESCO's listing supplies maps as well as a description. These allow the boundary under discussion to be identified as a boundary of the heritage property, rather than assumed to be the edge of all old buildings or of the modern city. The skyline and the roofs in the photograph extend beyond what a single designation needs to encompass. A place can be in the view, next to the historic area or important to the experience of its setting without being inside every line drawn around it.
Imagine a photograph cropped close to a large church and several surrounding blocks. It tells a reader less about where one planning designation ends. A heritage map can show the boundary precisely without making the buildings stand up from the page. A second map can be used to relate the boundary to streets people follow on the ground. Each serves a recognisable purpose when its lines are read by reference to their key.
The same principle helps with the word centre. It can describe a district known for certain buildings, a service area defined in a planning document or the middle of a drawing. Those meanings can overlap without turning into one single feature. The photograph from El Panecillo is not centred on an administrative line. It places a visible piece of the city within a view that happens to offer the height needed to recognise street patterns.
Make a plan and a profile for the same piece of ground
The place can also look different if the comparison starts at the edge of the historic area instead of the viewpoint. Mark a line across two nearby blocks and continue it toward a hill. The blocks may be of similar width while the terrain changes beyond them or even through them. In a simple model the same slope intersects several rectilinear lots without following their boundaries. Keeping the two layers separate shows why a street plan can preserve a strong geometric order amid uneven ground. Putting them together shows where that apparent conflict is experienced by someone moving across it.
This is a good reason to retain arrows and scales on small illustrations. With neither, a reader can mistake a figure drawn to show one crossing for a profile of the entire historic area or confuse the direction of El Panecillo with the orientation of the page. A little context keeps one clear line from claiming to represent more land than it actually crosses.
Start with a well identified source and draw a very plain plan: viewpoint, historic area and two or three conspicuous features. On a separate strip, draw a rough profile from the hill toward one of those features if height information is available. Leave a gap rather than putting in a guessed height. A pencil profile whose scale is named can be more explanatory than an impressive panorama whose vantage point is unknown.
Keep the date with the panorama too. The 1991 photograph is an observation of Quito on a particular occasion, well before many later records that can be read alongside it. A comparison can show that a building or open area differs between two dates. It cannot by itself supply a reason for the change. To learn about the reasons, look for plans, works and local records associated with the place, and be ready for the dates of the records and the visible work to differ.
From El Panecillo the amount of city that fits into one image can seem surprising. The next surprise is how much does not fit: the slopes between nearby roofs, the changes below the line of sight and the purposes for which a boundary was drawn. A street map, a photograph and a sketch of elevation can each recover a different part. The hill is useful because it encourages all three views of the same ground.