The Dry Side of the Olympic Mountains
The forests and farms of Washington’s Olympic Peninsula do not share one rainfall figure. An eastward sketch shows how nearby places can receive very different amounts of water.
In this story 4 sections
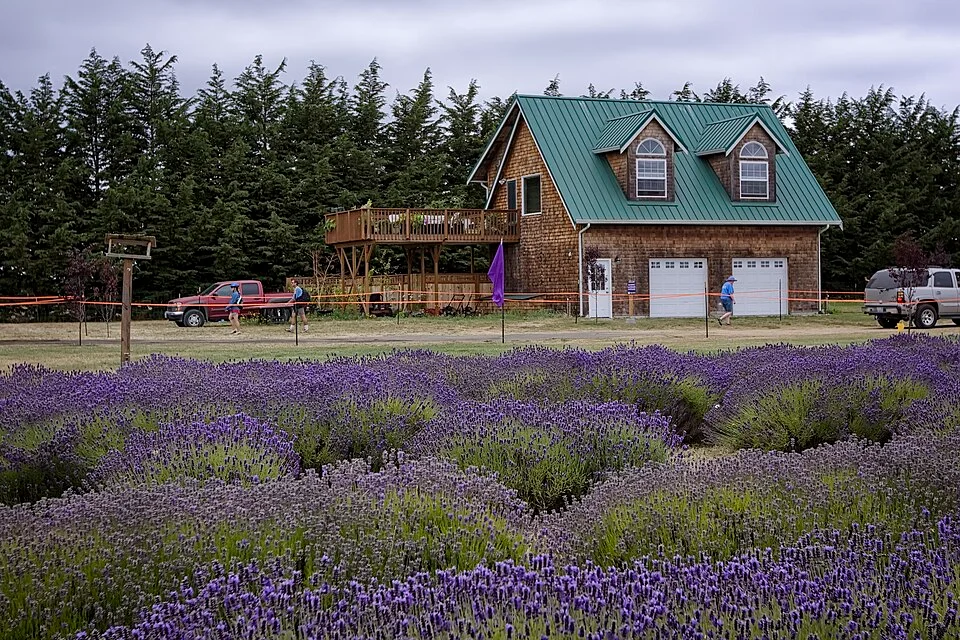
A row of lavender near Sequim, Washington, can be photographed without resolving the fact that some very wet forests grow not far away. The leaf color, visible soil and length of the field seem to tell a story about this ground. There is little in the photograph to say how often clouds delivered water here or to the west, and little about the work it takes to keep the field in the condition shown. The reason to place the picture on a map is the remarkable difference between places close enough to sit on the same page. One can be in the path up the Olympic Mountains, another in a comparatively dry part of their lee.
The National Park Service describes a rain shadow in the northeastern Olympic Peninsula. Before thinking of it as an exact line, place the mountains on the peninsula and locate a broad approach from the Pacific. When moist air from that direction rises over the terrain, it can cool enough for water vapor to condense and precipitation to develop. Conditions can favor abundant rain or snow on the exposed side. Air coming downslope on the other side can warm and become comparatively unfavorable for more precipitation. Where you look in relation to those motions gives the basic geography of the difference.
The water did not drop out at the front gate
The first useful sketch is not a line over a perfectly symmetrical triangle. Give the mountains several ridges and valleys. Put a coast on the west. Move an arrow past the lower ground toward one face of the range and let it go upward. The path can support condensation as the air cools. Precipitation may fall well before the highest place, or it may be organized in a pattern that depends on the wind and storm. More than one ridge can take part. A line drawn straight over a pointed summit illustrates the idea of climbing air while concealing a good deal of the real distribution.
Now follow a path of descent. Air warming on its way down can support a larger amount of vapor before reaching saturation. If the flow has previously lost some moisture through precipitation, the amount available can be lower too. The combination can help explain a drier area on the far side. That is what the word shadow is doing in this context. The mountain has changed something brought across it by the movement of air. It has not hung a physical roof over a settled rectangle of land.
The effect depends on direction. The side away from the prevailing rain-bearing flow in an important pattern need not be away from every wind on every day. Conditions at low elevation do not always describe those over a ridge. Strong or weak flow and the structure of weather systems can alter the pattern. A resident who heard rain at night is not offering a counterexample to the existence of a rain shadow. They are describing a period small enough that a regional pattern cannot be expected to supply every detail.
The west and east figures belong to places
The park’s weather brochure puts rainfall estimates from different settings into the same table: the coast, a west-side rain forest valley, Port Angeles and Sequim in the northeastern shadow. That lets a reader see differences from one setting to another within a common official account. Keep the names next to the numbers when making your own version. A high point in the range can receive water in a different form or amount from a low valley. Neither a figure for a town nor a large figure for one wet forest should be called the rainfall of the entire peninsula.
A particularly useful chart can keep the monthly measures visible. One can then compare both the annual difference and how the high and low portions of the year fall. If two locations each have relatively dry summers, their summer values still need not be similar. One weather observation during a summer visit may tell a visitor more about the time of year than about which way they have traveled across the range. Monthly observations make it possible to keep those explanations separate and recognize differences that the annual totals compress.
Even a closely measured point has limits. A rain gauge records water at its own site and under a documented method. A nearby forest can receive moisture from fog or have snowfall at an elevation with different exposure. These parts do not always appear in the data a reader has chosen. The brochure itself calls attention to snow in mountain country and the role of fog in the west-side forest. A clear description states what has been measured and asks whether it covers the kind of moisture that matters to the question.
Consider two entries from the park’s yearly comparison. It puts the Hoh rain forest valley around 135 inches and Sequim around 16 inches. A division of those approximate totals gives a factor of more than eight. Taking that factor into the next sentence as a year-round or peninsula-wide constant would give it too much work to do. Some seasons contribute more of the contrast than others. The numbers are for named settings. Changing the ends of the comparison will change the factors.
A useful shorthand is to plot proportion and total separately. One line answers which part of the year a location tends to receive most of its water. Another answers how much typically lands there. Even places with comparable seasonal timing can receive quite distinct amounts. A resident concerned about summer water can have a reason to care about the contribution that fell as winter snow elsewhere, while a gauge read in summer records the water reaching its own point during that period.
A place can consequently experience shortage in one period despite a large reported annual total. That is a separate question about timing and water availability. Put the season in the claim if that is what you mean.
A dry field is not just an outcome of the sky
The photograph of lavender near Sequim records a working landscape rather than a direct measurement of the air above it. A farm can grow something on drier ground in part because water is made available and managed under local conditions. The National Park Service notes irrigation in the drier northeastern setting. The photo does not prove which regime a particular grower used or how dry the field was at the time. A description of the climatic context is a different thing from an observation of management on the particular day represented.
Think of walking up to two fields that look equally green. One might receive ample rain for part of its year and retain water in the soil. The other could be managed to give plants water at a different time. Appearance alone does not separate the stories. If you are comparing land covers on the map, include the elevation and sources of water before treating a photograph as if it showed the weather in its unaltered form. Similarly, a view of an especially tall forest depends on soil, past use and other conditions as well as precipitation.
A drawing that leaves land out can also lose a significant detail: people put houses, orchards and roads in particular parts of the low ground. Two settlements surrounded by different terrain may give a visitor different impressions of the same broad rain contrast. The landscape is not a controlled test in which rainfall was the only variable. Use the photographs to place observations and the interpreted weather records to understand the climate. Neither needs to perform the job of the other.
Build a comparison you can take apart
Mark four positions on a small map: an exposed coast, a west-side valley, a point higher in the range and a northeastern town. Next to each put likely influences, such as elevation and direction of exposure. Use a dated source for actual precipitation comparisons. Keep any note about snow, fog or conditions during a visit on a second line. A small set of clear labels will reveal when a writer has quietly compared one location’s annual record with another’s characteristic winter conditions.
If you want to know where the contrast is sharpest, a pair of widely separated readings can show that there is a difference without identifying its transition. Add one or two documented sites between them, and check whether the measurements are sufficiently comparable. A new foothill point could sit high enough to change the comparison even when it is not much farther east. On a map the difference between a transect at roughly the same elevation and one that crosses a mountain ridge should be shown rather than left implicit.
Return to the long rows in the photograph. The dry side of a range can be explained with a sketch that begins out at sea and ends near the field, but it is not written in any single leaf or path between the plants. It belongs to a relationship between weather and topography, with public records to help describe the result. What makes the peninsula an instructive place to look is the distance across which the contrast can be noticed. It is considerable in the weather account and quite small on the map.